build · memo
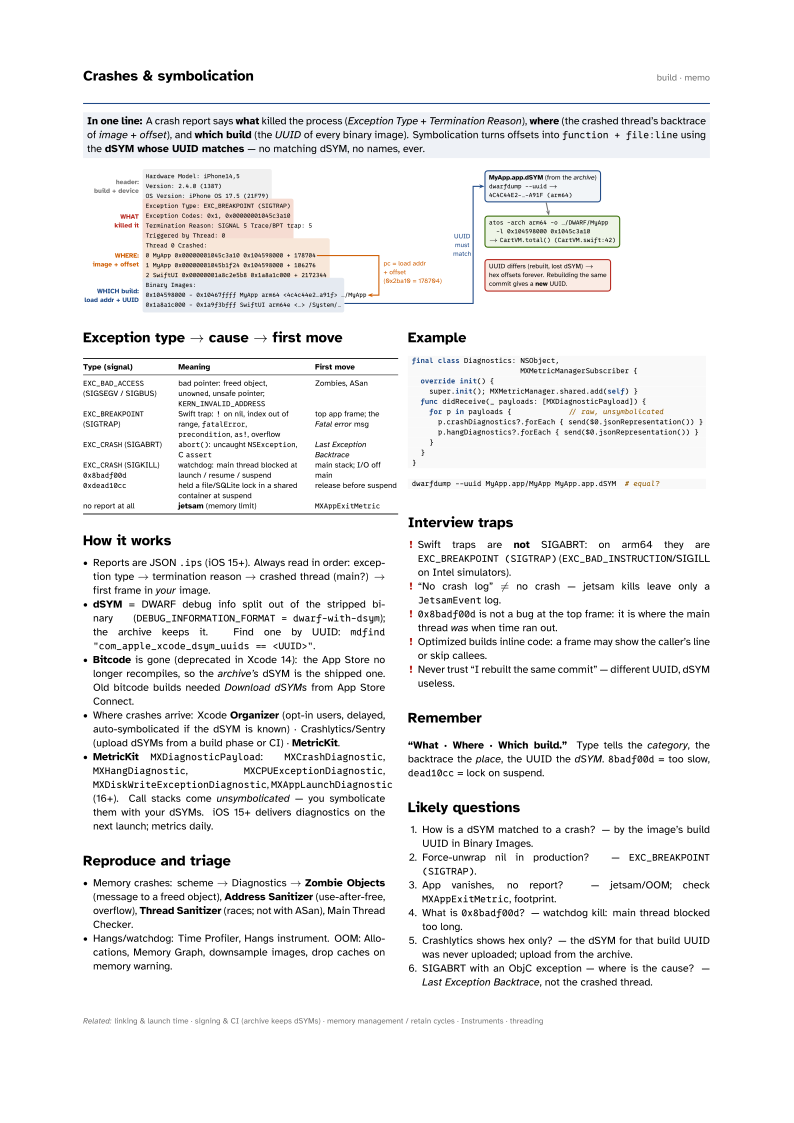
In one line: A crash report says what killed the process (Exception Type +
Termination Reason), where (the crashed thread’s backtrace of
image + offset), and which build (the UUID of every binary image).
Symbolication turns offsets into function + file:line using the dSYM whose
UUID matches — no matching dSYM, no names, ever.
Download PDF Print view LaTeX source
Exception type → cause → first move
| Type (signal) | Meaning | First move |
|---|---|---|
EXC_BAD_ACCESS (SIGSEGV / SIGBUS) | bad pointer: freed object, unowned, unsafe pointer; KERN_INVALID_ADDRESS | Zombies, ASan |
EXC_BREAKPOINT (SIGTRAP) | Swift trap: ! on nil, index out of range, fatalError, precondition, as!, overflow | top app frame; the Fatal error msg |
EXC_CRASH (SIGABRT) | abort(): uncaught NSException, C assert | Last Exception Backtrace |
EXC_CRASH (SIGKILL) 0x8badf00d | watchdog: main thread blocked at launch / resume / suspend | main stack; I/O off main |
0xdead10cc | held a file/SQLite lock in a shared container at suspend | release before suspend |
| no report at all | jetsam (memory limit) | MXAppExitMetric |
How it works
- Reports are JSON
.ips(iOS 15+). Always read in order: exception type → termination reason → crashed thread (main?) → first frame in your image. - dSYM = DWARF debug info split out of the stripped binary (
DEBUG_INFORMATION_FORMAT = dwarf-with-dsym); the archive keeps it. Find one by UUID:mdfind "com_apple_xcode_dsym_uuids == <UUID>". - Bitcode is gone (deprecated in Xcode 14): the App Store no longer recompiles, so the archive’s dSYM is the shipped one. Old bitcode builds needed Download dSYMs from App Store Connect.
- Where crashes arrive: Xcode Organizer (opt-in users, delayed, auto-symbolicated if the dSYM is known) · Crashlytics/Sentry (upload dSYMs from a build phase or CI) · MetricKit.
- MetricKit
MXDiagnosticPayload:MXCrashDiagnostic,MXHangDiagnostic,MXCPUExceptionDiagnostic,MXDiskWriteExceptionDiagnostic,MXAppLaunchDiagnostic(16+). Call stacks come unsymbolicated — you symbolicate them with your dSYMs. iOS 15+ delivers diagnostics on the next launch; metrics daily.
Reproduce and triage
- Memory crashes: scheme → Diagnostics → Zombie Objects (message to a freed object), Address Sanitizer (use-after-free, overflow), Thread Sanitizer (races; not with ASan), Main Thread Checker.
- Hangs/watchdog: Time Profiler, Hangs instrument. OOM: Allocations, Memory Graph, downsample images, drop caches on memory warning.
Example
final class Diagnostics: NSObject,
                         MXMetricManagerSubscriber {
  override init() {
    super.init(); MXMetricManager.shared.add(self) }
  func didReceive(_ payloads: [MXDiagnosticPayload]) {
    for p in payloads {             // raw, unsymbolicated
      p.crashDiagnostics?.forEach { send($0.jsonRepresentation()) }
      p.hangDiagnostics?.forEach { send($0.jsonRepresentation()) }
    }
  }
}
dwarfdump --uuid MyApp.app/MyApp MyApp.app.dSYM # equal?Interview traps
- Swift traps are not SIGABRT: on arm64 they are
EXC_BREAKPOINT (SIGTRAP)(EXC_BAD_INSTRUCTION/SIGILL on Intel simulators). - “No crash log” ≠ no crash — jetsam kills leave only a
JetsamEventlog. 0x8badf00dis not a bug at the top frame: it is where the main thread was when time ran out.- Optimized builds inline code: a frame may show the caller’s line or skip callees.
- Never trust “I rebuilt the same commit” — different UUID, dSYM useless.
Remember
“What · Where · Which build.” Type tells the category, the backtrace the place, the UUID the dSYM. 8badf00d = too slow, dead10cc = lock on suspend.
Likely questions
- How is a dSYM matched to a crash? — by the image’s build UUID in Binary Images.
- Force-unwrap nil in production? —
EXC_BREAKPOINT (SIGTRAP). - App vanishes, no report? — jetsam/OOM; check
MXAppExitMetric, footprint. - What is
0x8badf00d? — watchdog kill: main thread blocked too long. - Crashlytics shows hex only? — the dSYM for that build UUID was never uploaded; upload from the archive.
- SIGABRT with an ObjC exception — where is the cause? — Last Exception Backtrace, not the crashed thread.