react-native · memo
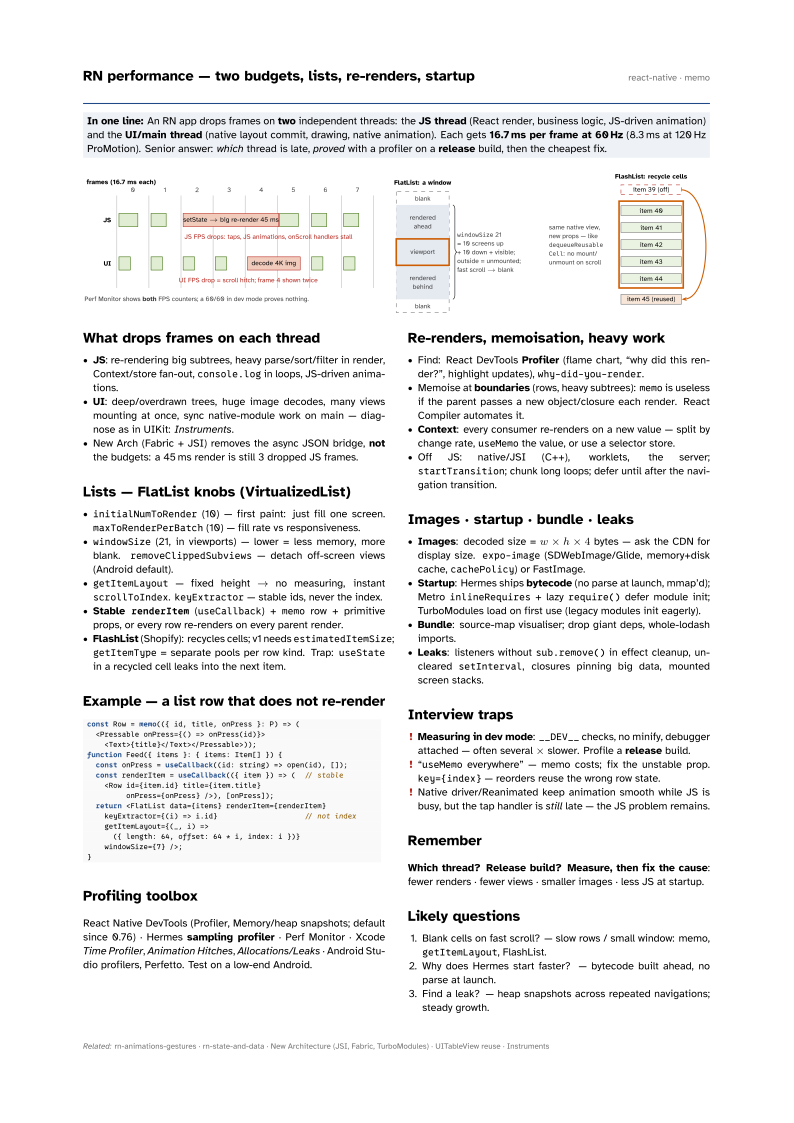
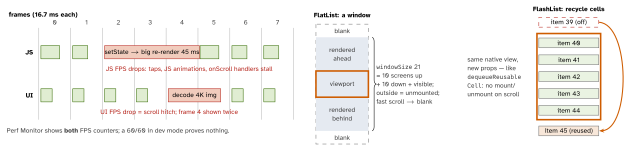
In one line: An RN app drops frames on two independent threads: the JS thread (React render, business logic, JS-driven animation) and the UI/main thread (native layout commit, drawing, native animation). Each gets 16.7 ms per frame at 60 Hz (8.3 ms at 120 Hz ProMotion). Senior answer: which thread is late, proved with a profiler on a release build, then the cheapest fix.
Download PDF Print view LaTeX source
What drops frames on each thread
- JS: re-rendering big subtrees, heavy parse/sort/filter in render, Context/store fan-out,
console.login loops, JS-driven animations. - UI: deep/overdrawn trees, huge image decodes, many views mounting at once, sync native-module work on main — diagnose as in UIKit: Instruments.
- New Arch (Fabric + JSI) removes the async JSON bridge, not the budgets: a 45 ms render is still 3 dropped JS frames.
Lists — FlatList knobs (VirtualizedList)
initialNumToRender(10) — first paint: just fill one screen.maxToRenderPerBatch(10) — fill rate vs responsiveness.windowSize(21, in viewports) — lower = less memory, more blank.removeClippedSubviews— detach off-screen views (Android default).getItemLayout— fixed height → no measuring, instantscrollToIndex.keyExtractor— stable ids, never the index.- Stable
renderItem(useCallback) +memorow + primitive props, or every row re-renders on every parent render. - FlashList (Shopify): recycles cells; v1 needs
estimatedItemSize;getItemType= separate pools per row kind. Trap:useStatein a recycled cell leaks into the next item.
Example — a list row that does not re-render
const Row = memo(({ id, title, onPress }: P) => (
  <Pressable onPress={() => onPress(id)}>
    <Text>{title}</Text></Pressable>));
function Feed({ items }: { items: Item[] }) {
  const onPress = useCallback((id: string) => open(id), []);
  const renderItem = useCallback(({ item }) => (  // stable
    <Row id={item.id} title={item.title}
         onPress={onPress} />), [onPress]);
  return <FlatList data={items} renderItem={renderItem}
    keyExtractor={(i) => i.id}                    // not index
    getItemLayout={(_, i) =>
      ({ length: 64, offset: 64 * i, index: i })}
    windowSize={7} />;
}
Profiling toolbox
React Native DevTools (Profiler, Memory/heap snapshots; default since 0.76) · Hermes sampling profiler · Perf Monitor · Xcode Time Profiler, Animation Hitches, Allocations/Leaks · Android Studio profilers, Perfetto. Test on a low-end Android.
Re-renders, memoisation, heavy work
- Find: React DevTools Profiler (flame chart, “why did this render?”, highlight updates),
why-did-you-render. - Memoise at boundaries (rows, heavy subtrees):
memois useless if the parent passes a new object/closure each render. React Compiler automates it. - Context: every consumer re-renders on a new value — split by change rate,
useMemothe value, or use a selector store. - Off JS: native/JSI (C++), worklets, the server;
startTransition; chunk long loops; defer until after the navigation transition.
Images · startup · bundle · leaks
- Images: decoded size = w ×h ×4 bytes — ask the CDN for display size.
expo-image(SDWebImage/Glide, memory+disk cache,cachePolicy) or FastImage. - Startup: Hermes ships bytecode (no parse at launch, mmap’d); Metro
inlineRequires+ lazyrequire()defer module init; TurboModules load on first use (legacy modules init eagerly). - Bundle: source-map visualiser; drop giant deps, whole-lodash imports.
- Leaks: listeners without
sub.remove()in effect cleanup, unclearedsetInterval, closures pinning big data, mounted screen stacks.
Interview traps
- Measuring in dev mode:
__DEV__checks, no minify, debugger attached — often several × slower. Profile a release build. - “
useMemoeverywhere” — memo costs; fix the unstable prop.key={index}— reorders reuse the wrong row state. - Native driver/Reanimated keep animation smooth while JS is busy, but the tap handler is still late — the JS problem remains.
Remember
Which thread? Release build? Measure, then fix the cause: fewer renders · fewer views · smaller images · less JS at startup.
Likely questions
- Blank cells on fast scroll? — slow rows / small window: memo,
getItemLayout, FlashList. - Why does Hermes start faster? — bytecode built ahead, no parse at launch.
- Find a leak? — heap snapshots across repeated navigations; steady growth.