debugging · memo
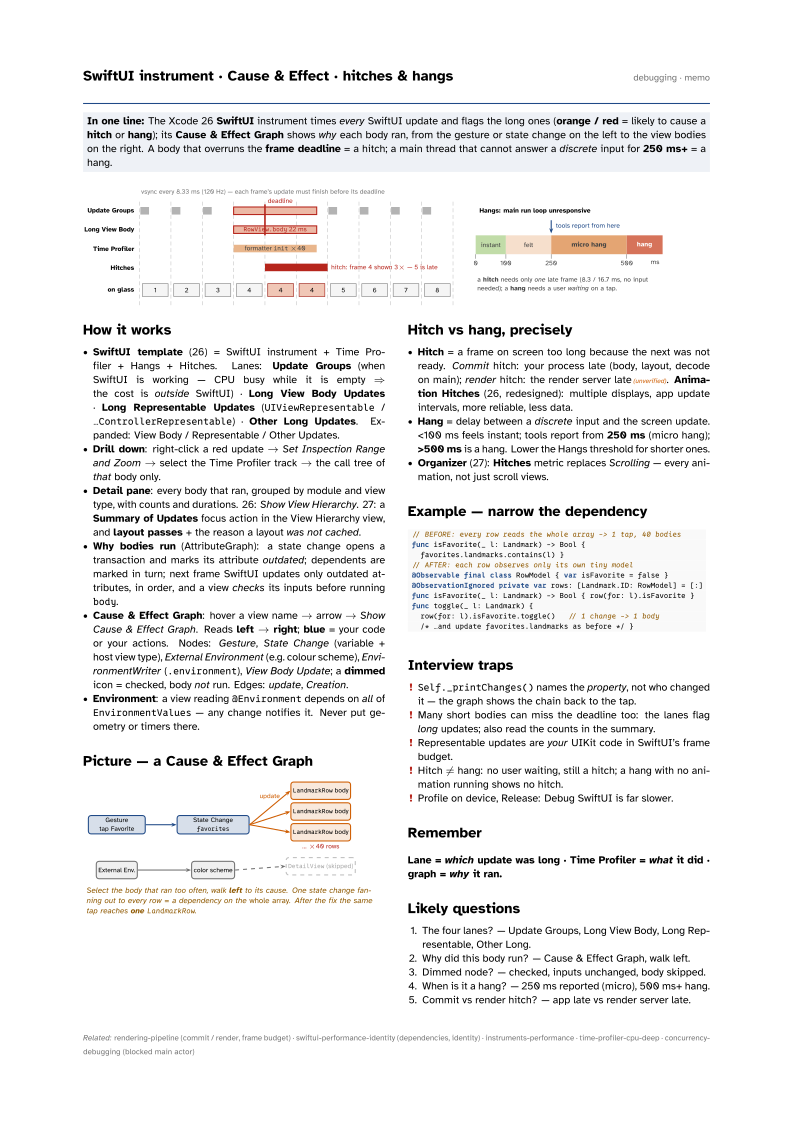
In one line: The Xcode 26 SwiftUI instrument times every SwiftUI update and flags the long ones (orange / red = likely to cause a hitch or hang); its Cause & Effect Graph shows why each body ran, from the gesture or state change on the left to the view bodies on the right. A body that overruns the frame deadline = a hitch; a main thread that cannot answer a discrete input for 250 ms+ = a hang.
Download PDF Print view LaTeX source
How it works
- SwiftUI template (26) = SwiftUI instrument + Time Profiler + Hangs + Hitches. Lanes: Update Groups (when SwiftUI is working — CPU busy while it is empty ⇒ the cost is outside SwiftUI) · Long View Body Updates · Long Representable Updates (
UIViewRepresentable/…ControllerRepresentable) · Other Long Updates. Expanded: View Body / Representable / Other Updates. - Drill down: right-click a red update → Set Inspection Range and Zoom → select the Time Profiler track → the call tree of that body only.
- Detail pane: every body that ran, grouped by module and view type, with counts and durations. 26: Show View Hierarchy. 27: a Summary of Updates focus action in the View Hierarchy view, and layout passes + the reason a layout was not cached.
- Why bodies run (AttributeGraph): a state change opens a transaction and marks its attribute outdated; dependents are marked in turn; next frame SwiftUI updates only outdated attributes, in order, and a view checks its inputs before running
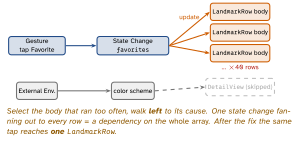
body. - Cause & Effect Graph: hover a view name → arrow → Show
Cause & Effect Graph. Reads left → right; blue = your code or your actions. Nodes: Gesture, State Change (variable + host view type), External Environment (e.g. colour scheme), EnvironmentWriter (
.environment), View Body Update; a dimmed icon = checked, body not run. Edges: update, Creation. - Environment: a view reading
@Environmentdepends on all ofEnvironmentValues— any change notifies it. Never put geometry or timers there.
Picture — a Cause & Effect Graph
Hitch vs hang, precisely
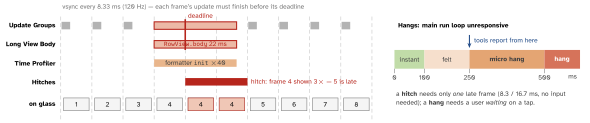
- Hitch = a frame on screen too long because the next was not ready. Commit hitch: your process late (body, layout, decode on main); render hitch: the render server late(unverified). Animation Hitches (26, redesigned): multiple displays, app update intervals, more reliable, less data.
- Hang = delay between a discrete input and the screen update. <100 ms feels instant; tools report from 250 ms (micro hang); >500 ms is a hang. Lower the Hangs threshold for shorter ones.
- Organizer (27): Hitches metric replaces Scrolling — every animation, not just scroll views.
Example — narrow the dependency
// BEFORE: every row reads the whole array -> 1 tap, 40 bodies
func isFavorite(_ l: Landmark) -> Bool {
  favorites.landmarks.contains(l) }
// AFTER: each row observes only its own tiny model
@Observable final class RowModel { var isFavorite = false }
@ObservationIgnored private var rows: [Landmark.ID: RowModel] = [:]
func isFavorite(_ l: Landmark) -> Bool { row(for: l).isFavorite }
func toggle(_ l: Landmark) {
  row(for: l).isFavorite.toggle()   // 1 change -> 1 body
  /* …and update favorites.landmarks as before */ }
Interview traps
Self._printChanges()names the property, not who changed it — the graph shows the chain back to the tap.- Many short bodies can miss the deadline too: the lanes flag long updates; also read the counts in the summary.
- Representable updates are your UIKit code in SwiftUI’s frame budget.
- Hitch ≠ hang: no user waiting, still a hitch; a hang with no animation running shows no hitch.
- Profile on device, Release: Debug SwiftUI is far slower.
Remember
Lane = which update was long · Time Profiler = what it did · graph = why it ran.
Likely questions
- The four lanes? — Update Groups, Long View Body, Long Representable, Other Long.
- Why did this body run? — Cause & Effect Graph, walk left.
- Dimmed node? — checked, inputs unchanged, body skipped.
- When is it a hang? — 250 ms reported (micro), 500 ms+ hang.
- Commit vs render hitch? — app late vs render server late.