debugging · memo
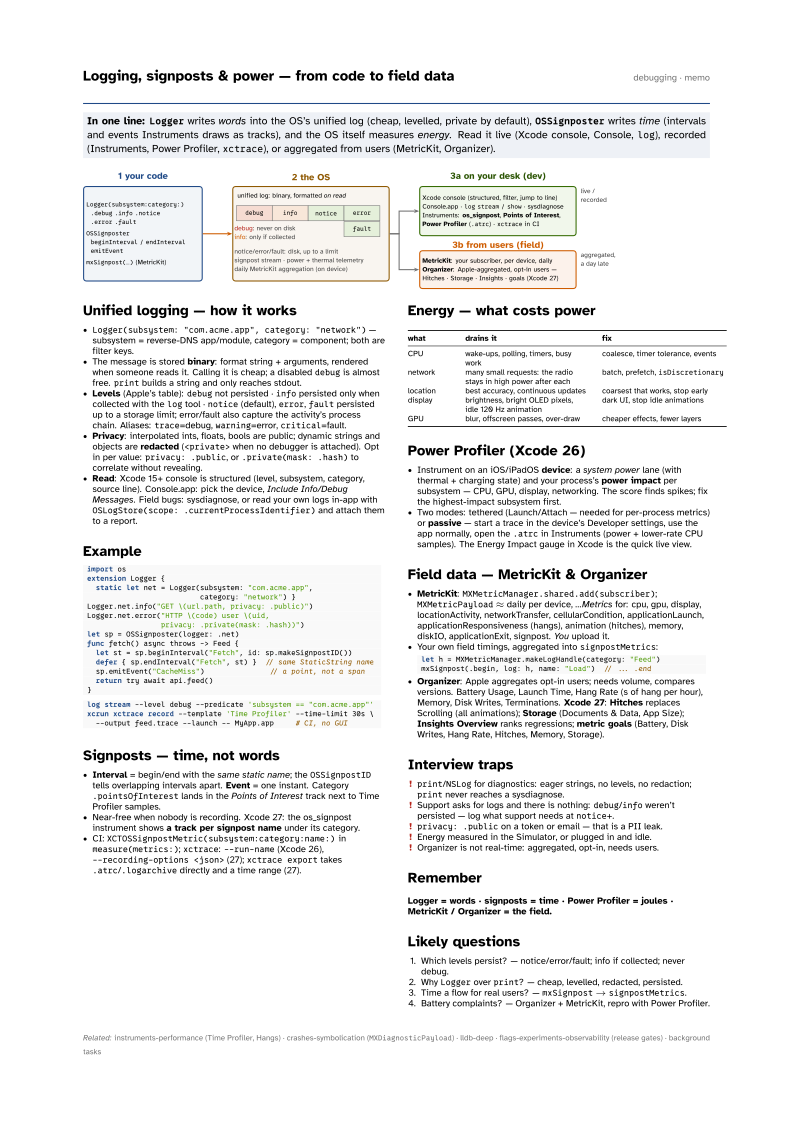
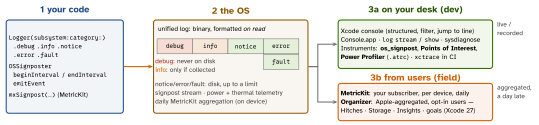
In one line: Logger writes words into the OS’s unified log
(cheap, levelled, private by default), OSSignposter writes
time (intervals and events Instruments draws as tracks), and the OS itself
measures energy. Read it live (Xcode console, Console, log),
recorded (Instruments, Power Profiler, xctrace), or aggregated from users
(MetricKit, Organizer).
Download PDF Print view LaTeX source
Unified logging — how it works
Logger(subsystem: "com.acme.app", category: "network")— subsystem = reverse-DNS app/module, category = component; both are filter keys.- The message is stored binary: format string + arguments, rendered when someone reads it. Calling it is cheap; a disabled
debugis almost free.printbuilds a string and only reaches stdout. - Levels (Apple’s table):
debugnot persisted ·infopersisted only when collected with thelogtool ·notice(default),error,faultpersisted up to a storage limit; error/fault also capture the activity’s process chain. Aliases:trace=debug,warning=error,critical=fault. - Privacy: interpolated ints, floats, bools are public; dynamic strings and objects are redacted (
<private>when no debugger is attached). Opt in per value:privacy: .public, or.private(mask: .hash)to correlate without revealing. - Read: Xcode 15+ console is structured (level, subsystem, category, source line). Console.app: pick the device, Include
Info/Debug Messages. Field bugs: sysdiagnose, or read your own logs in-app with
OSLogStore(scope: .currentProcessIdentifier)and attach them to a report.
Example
import os
extension Logger {
  static let net = Logger(subsystem: "com.acme.app",
                          category: "network") }
Logger.net.info("GET \(url.path, privacy: .public)")
Logger.net.error("HTTP \(code) user \(uid,
                 privacy: .private(mask: .hash))")
let sp = OSSignposter(logger: .net)
func fetch() async throws -> Feed {
  let st = sp.beginInterval("Fetch", id: sp.makeSignpostID())
  defer { sp.endInterval("Fetch", st) }  // same StaticString name
  sp.emitEvent("CacheMiss")               // a point, not a span
  return try await api.feed()
}
log stream --level debug --predicate 'subsystem == "com.acme.app"'
xcrun xctrace record --template 'Time Profiler' --time-limit 30s \
--output feed.trace --launch -- MyApp.app # CI, no GUISignposts — time, not words
- Interval = begin/end with the same static name; the
OSSignpostIDtells overlapping intervals apart. Event = one instant. Category.pointsOfInterestlands in the Points of Interest track next to Time Profiler samples. - Near-free when nobody is recording. Xcode 27: the os_signpost instrument shows a track per signpost name under its category.
- CI:
XCTOSSignpostMetric(subsystem:category:name:)inmeasure(metrics:);xctrace:--run-name(Xcode 26),--recording-options <json>(27);xctrace exporttakes.atrc/.logarchivedirectly and a time range (27).
Energy — what costs power
| what | drains it | fix |
|---|---|---|
| CPU | wake-ups, polling, timers, busy work | coalesce, timer tolerance, events |
| network | many small requests: the radio stays in high power after each | batch, prefetch, isDiscretionary |
| location | best accuracy, continuous updates | coarsest that works, stop early |
| display | brightness, bright OLED pixels, idle 120 Hz animation | dark UI, stop idle animations |
| GPU | blur, offscreen passes, over-draw | cheaper effects, fewer layers |
Power Profiler (Xcode 26)
- Instrument on an iOS/iPadOS device: a system power lane (with thermal + charging state) and your process’s power impact per subsystem — CPU, GPU, display, networking. The score finds spikes; fix the highest-impact subsystem first.
- Two modes: tethered (Launch/Attach — needed for per-process metrics) or passive — start a trace in the device’s Developer settings, use the app normally, open the
.atrcin Instruments (power + lower-rate CPU samples). The Energy Impact gauge in Xcode is the quick live view.
Field data — MetricKit & Organizer
- MetricKit:
MXMetricManager.shared.add(subscriber);MXMetricPayload≈ daily per device, …Metrics for: cpu, gpu, display, locationActivity, networkTransfer, cellularCondition, applicationLaunch, applicationResponsiveness (hangs), animation (hitches), memory, diskIO, applicationExit, signpost. You upload it. Your own field timings, aggregated into
signpostMetrics:let h = MXMetricManager.makeLogHandle(category: "Feed") mxSignpost(.begin, log: h, name: "Load") // ... .end- Organizer: Apple aggregates opt-in users; needs volume, compares versions. Battery Usage, Launch Time, Hang Rate (s of hang per hour), Memory, Disk Writes, Terminations. Xcode 27: Hitches replaces Scrolling (all animations); Storage (Documents & Data, App Size); Insights Overview ranks regressions; metric goals (Battery, Disk Writes, Hang Rate, Hitches, Memory, Storage).
Interview traps
print/NSLogfor diagnostics: eager strings, no levels, no redaction;printnever reaches a sysdiagnose.- Support asks for logs and there is nothing:
debug/infoweren’t persisted — log what support needs atnotice+. privacy: .publicon a token or email — that is a PII leak.- Energy measured in the Simulator, or plugged in and idle.
- Organizer is not real-time: aggregated, opt-in, needs users.
Remember
Logger = words · signposts = time · Power Profiler = joules · MetricKit / Organizer = the field.
Likely questions
- Which levels persist? — notice/error/fault; info if collected; never debug.
- Why
Loggeroverprint? — cheap, levelled, redacted, persisted. - Time a flow for real users? —
mxSignpost→signpostMetrics. - Battery complaints? — Organizer + MetricKit, repro with Power Profiler.